Graphical Abstracts
Many journals are now requesting that authors submit a graphical abstract for original research papers. These are basically exactly what they sound like – short summaries of the paper in pictoral form. You would be forgiven for thinking that this is basically a paper in poster form – similar to posters that would be presented at a conference. However, posters are generally printed on A0 size paper, which is over a metre in length. In contrast, graphical abstracts are for printing on A4 size or to be viewed on screens of electronic devices as small as a smartphone. The vast difference in viewing size means that an effective graphical abstract needs to be much more concise than an academic poster.
Many academic writers find it difficult to summarise their papers to the size of a poster that is longer than the average UK adult male leg length, let alone to something that fits into your palm! As much of a challenge as this is, it is beneficial for us to learn this skill.
Why is the creation of an effective graphical abstract such an important skill to learn? After all, how much impact can such a concise summary have? In some cases it is not just a useful skill, but a necessary one – some journals now require that a graphical abstract is submitted alongside a paper and many others strongly encourage submitting one. In a world where convenience is key and every minute of our time comes at a premium, graphical abstracts mean that readers of academic papers don’t need to spend a minute or two reading a 250-word abstract; they can now decide whether a paper is worth reading or not in a matter of seconds.
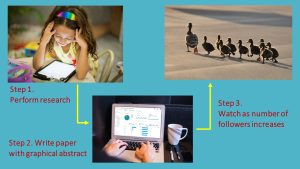
The ability to judge a paper at a glance is not the only benefit of a graphical abstract. These simple take-home messages in a pictoral package are ideal for sharing on social media. Many academics and research groups have a social media presence, and this is becoming one of the most effective ways of communicating with followers and increasing readership of papers. Having a picture summary of a paper is ideal for posting on social media, particularly with sites and apps that have a strict word limit on posts.
It has been suggested that the use of a graphical abstract doubles the average use per year of an article, although the evidence is sparse (Elsevier, 2021). There are, however, a number of sources suggesting that infographics significantly increase the reach of research (Ramos & Concepcion, 2020; West et al., 2020). Regardless of the magnitude of the effect a graphical abstract has on research, one thing is widely agreed: the use of pictures in almost any media increases the amount of viewer engagement.
Are there any downsides to this? Well, again, there is very little data, but there are no standardised guidelines for graphical abstracts. Most journals encouraging the use of graphical abstracts provide suggestions, and in some cases, templates for authors. However, these are individual to each publisher. In addition to this, if these infographics are not created effectively, they could confuse readers rather than informing. It is not surprising that a number of graphic designers have jumped on the bandwagon and are making money from academics who have little confidence in their artistic creativity.
Elsevier, 2021. Graphical Abstracts. https://www.elsevier.com/authors/tools-and-resources/graphical-abstract
Ramos, E. & Concepcion, B.P., 2020. Visual Abstracts: Redesigning the landscape of research dissemination. Seminars in Nephrology, 40 (3), 291-297.
West, C.C., Lindsay, K.J. & Hart, A., 2020. Promoting your research using infographics and visual abstracts. Journal of Plastic, Reconstructive & Aesthetic Surgery, 73 (12), 2103-2105
Photos by Brazil Topno and Myriam Jessier on Unsplash