This project explores tools and practices that may enable us and the public to capture, understand, and communicate the complexity of biodiversity in Morecambe Bay.
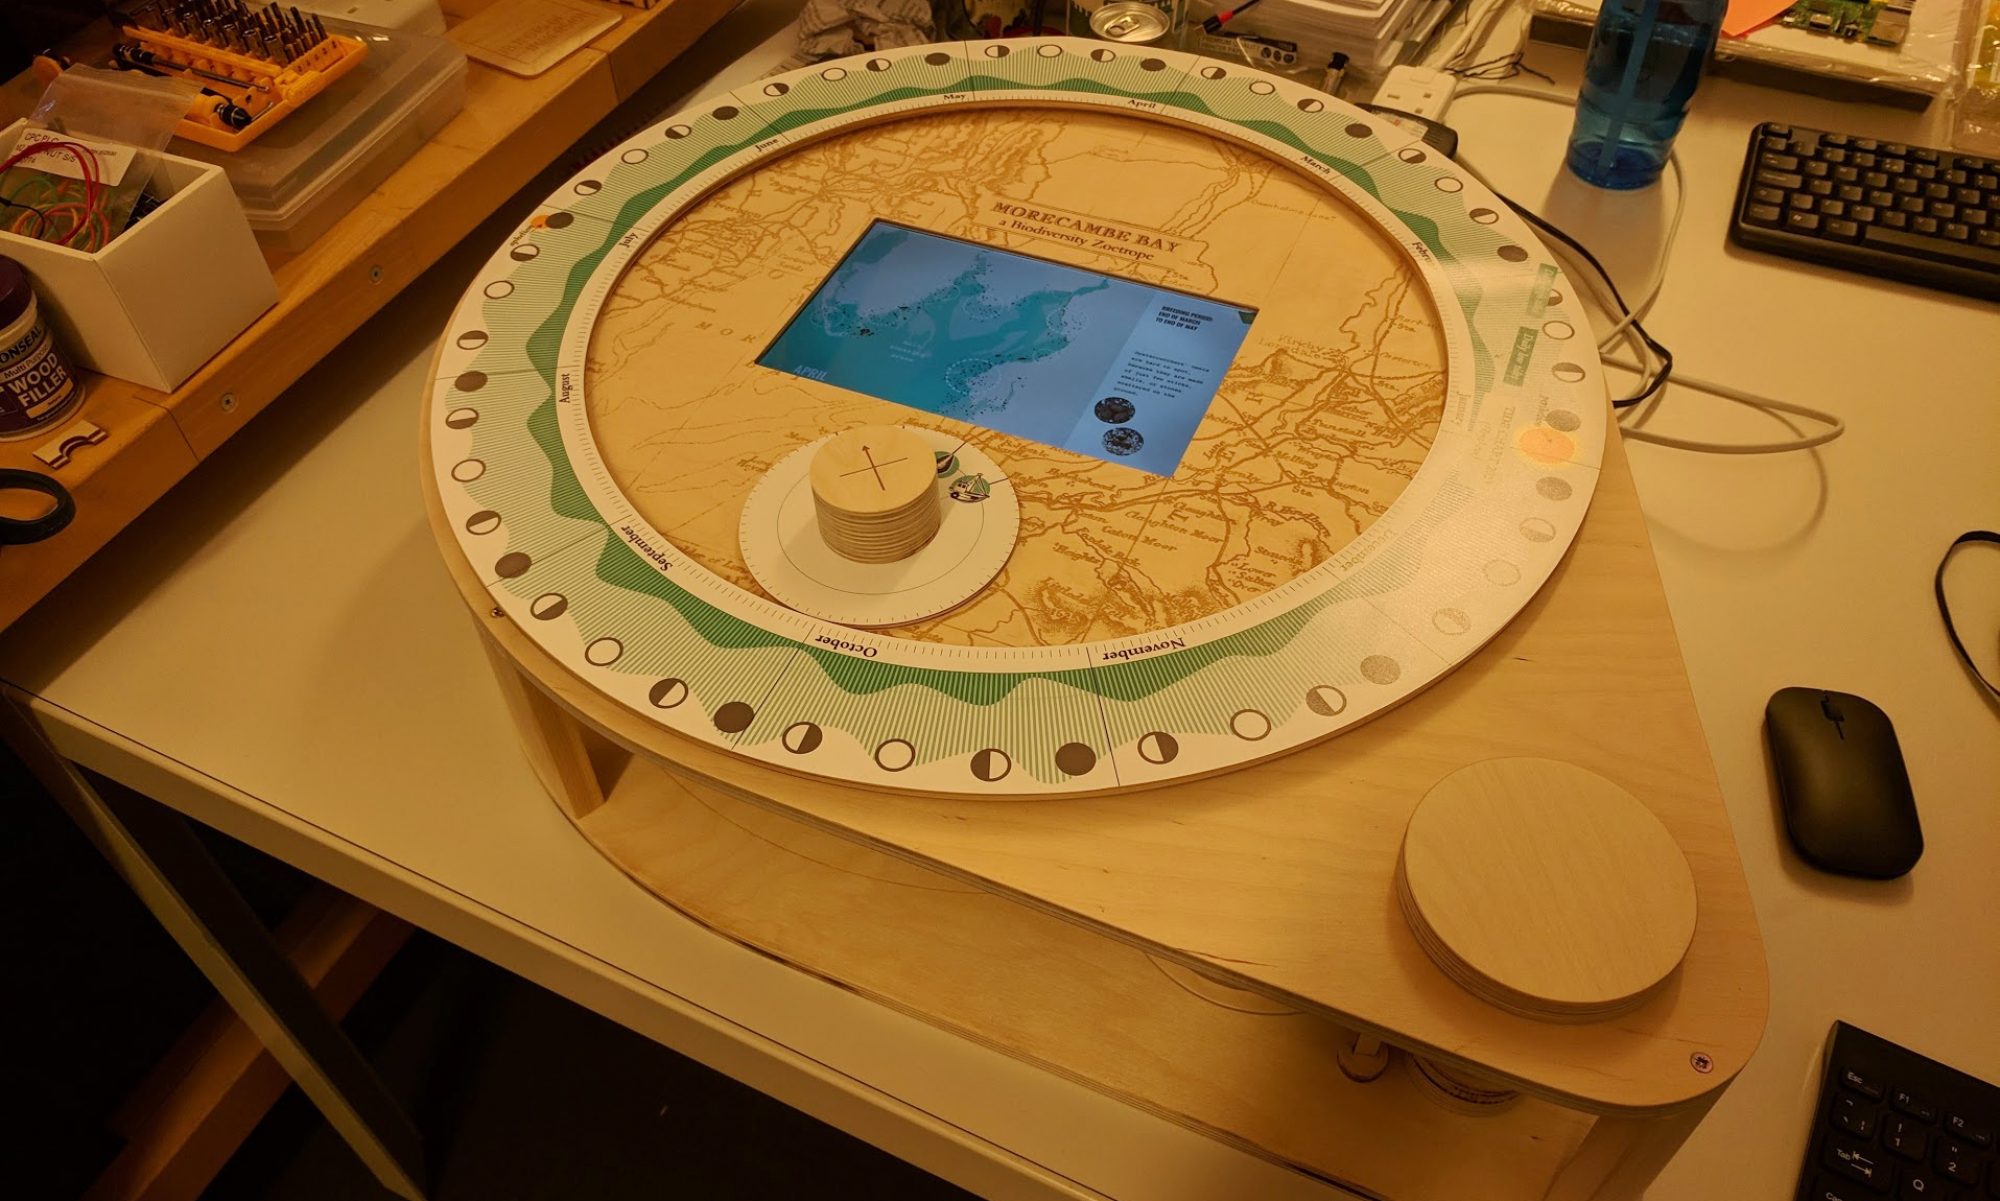
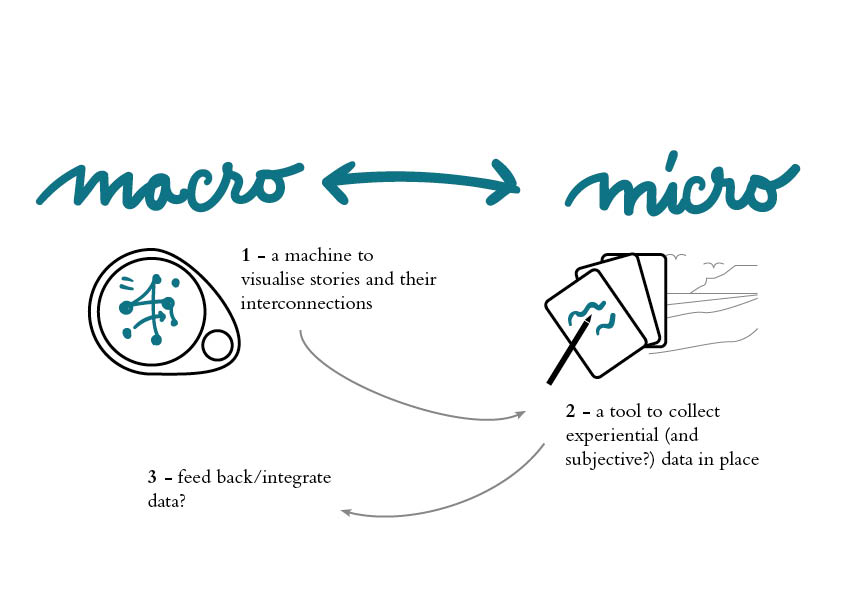
We started by building a data visualisation machine (our Biodiversity Zoetrope), which enables you to explore the different stories of the bay, and see their hidden interconnections. By spinning the zoetrope, you’ll be able to understand the entanglements of tides, creatures and communities living in the bay.
We wanted to build a machine that helps you see the sort of data that is hard to see directly (because too big, too hidden, or too complex). But this is only one part of the story: we believe that meaningful engagements with the bay require direct engagement with place, its rhythms, and its creatures.
So, we are now developing a toolkit that may allow people to collect their own personal, subjective, experiential data. And thinking of ways in which these data can be integrated with the stories of entanglements and complexity that the Biodiversity Zoetrope displays.
Morecambe Bay
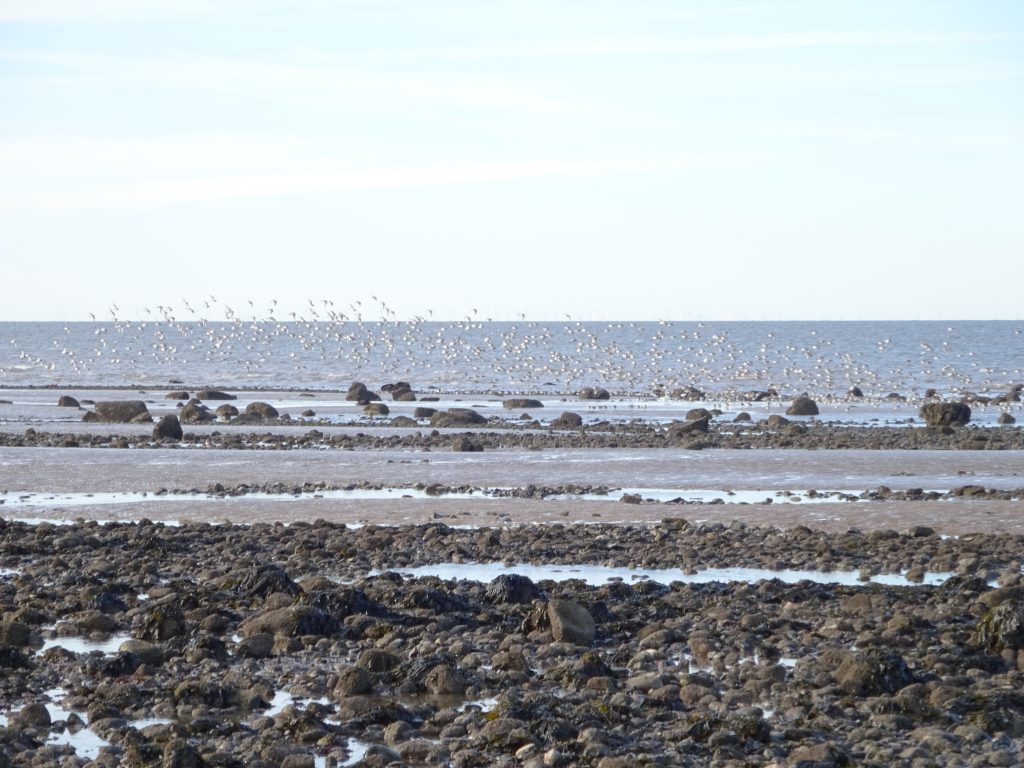
Morecambe Bay, in the North-West of England, has been designated Special Area of Conservation (SAC) because of its unique environmental characteristics. Morecambe Bay is the largest continuous area of intertidal mudflats and sandflats in the UK. In addition, there are four large river estuaries located on the site. These characteristics contribute to habitats of very diverse biological communities, living in mud flats, intertidal seagrasses, sands, skears, as well as along the coast. Most of these communities are highly influenced by tides (see http://jncc.defra.gov.uk/protectedsites/sacselection/sac.asp?EUCode=UK0013027)
The identity of Morecambe Bay can only be understood through the multiplicity of its flows. Scientists and stakeholders working with biodiversity issues are deeply familiar with these flows and their interactions, but the general public is often unaware of the complexity of this interconnected web.
For example, the population of cockles in Morecambe Bay is highly dependent on tides, weather, and environmental conditions. Oystercatchers that winter in the area rely on molluscs for their sustenance. For this reason, local fisheries and environmental agencies developed data sharing habits to inform their practices. These data stories constitute, in a sense, complex and dynamic portrait of some of the identities of the bay.
Phases of the project
The project is divided into three main phases:
- Phase 1: Research through data visualisation. In this first phase we worked with stakeholders to gather and organise relevant data-sets describing the flows of tides, cockles, and oystercatchers. We experiment with a visual vocabulary to represent these data. The aim of this phase is to build an initial visual description of the flows and their interconnections.
- Phase 2: Building the Device. Starting from the data gathered and the visual vocabulary developed in Phase 1, we developed a data-driven device to map data stories. Inspired by zoetropes and seismographs, our device employed a combination of digital and mechanical technologies to animate data and visualise the flows dynamically.
- Phase 3 (ongoing): The process for translating data into dynamic visualisations will be documented and made openly available. Based on this process, we will develop a manual for replicating the experience with analogue tools and for other types of data. Follow-on-funding for piloting this method with schools and organisations will be sought at the end of the project (departmental funding and/or UKRC).
—
This is project is funded by Ensemble, an EPSRC funded programme that is exploring digital technologies and environmental change.