 github: https://github.com/Cuauhtemoctzin/AnomalyScore
CRAN: https://cran.r-project.org/web/packages/AnomalyScore/index.html
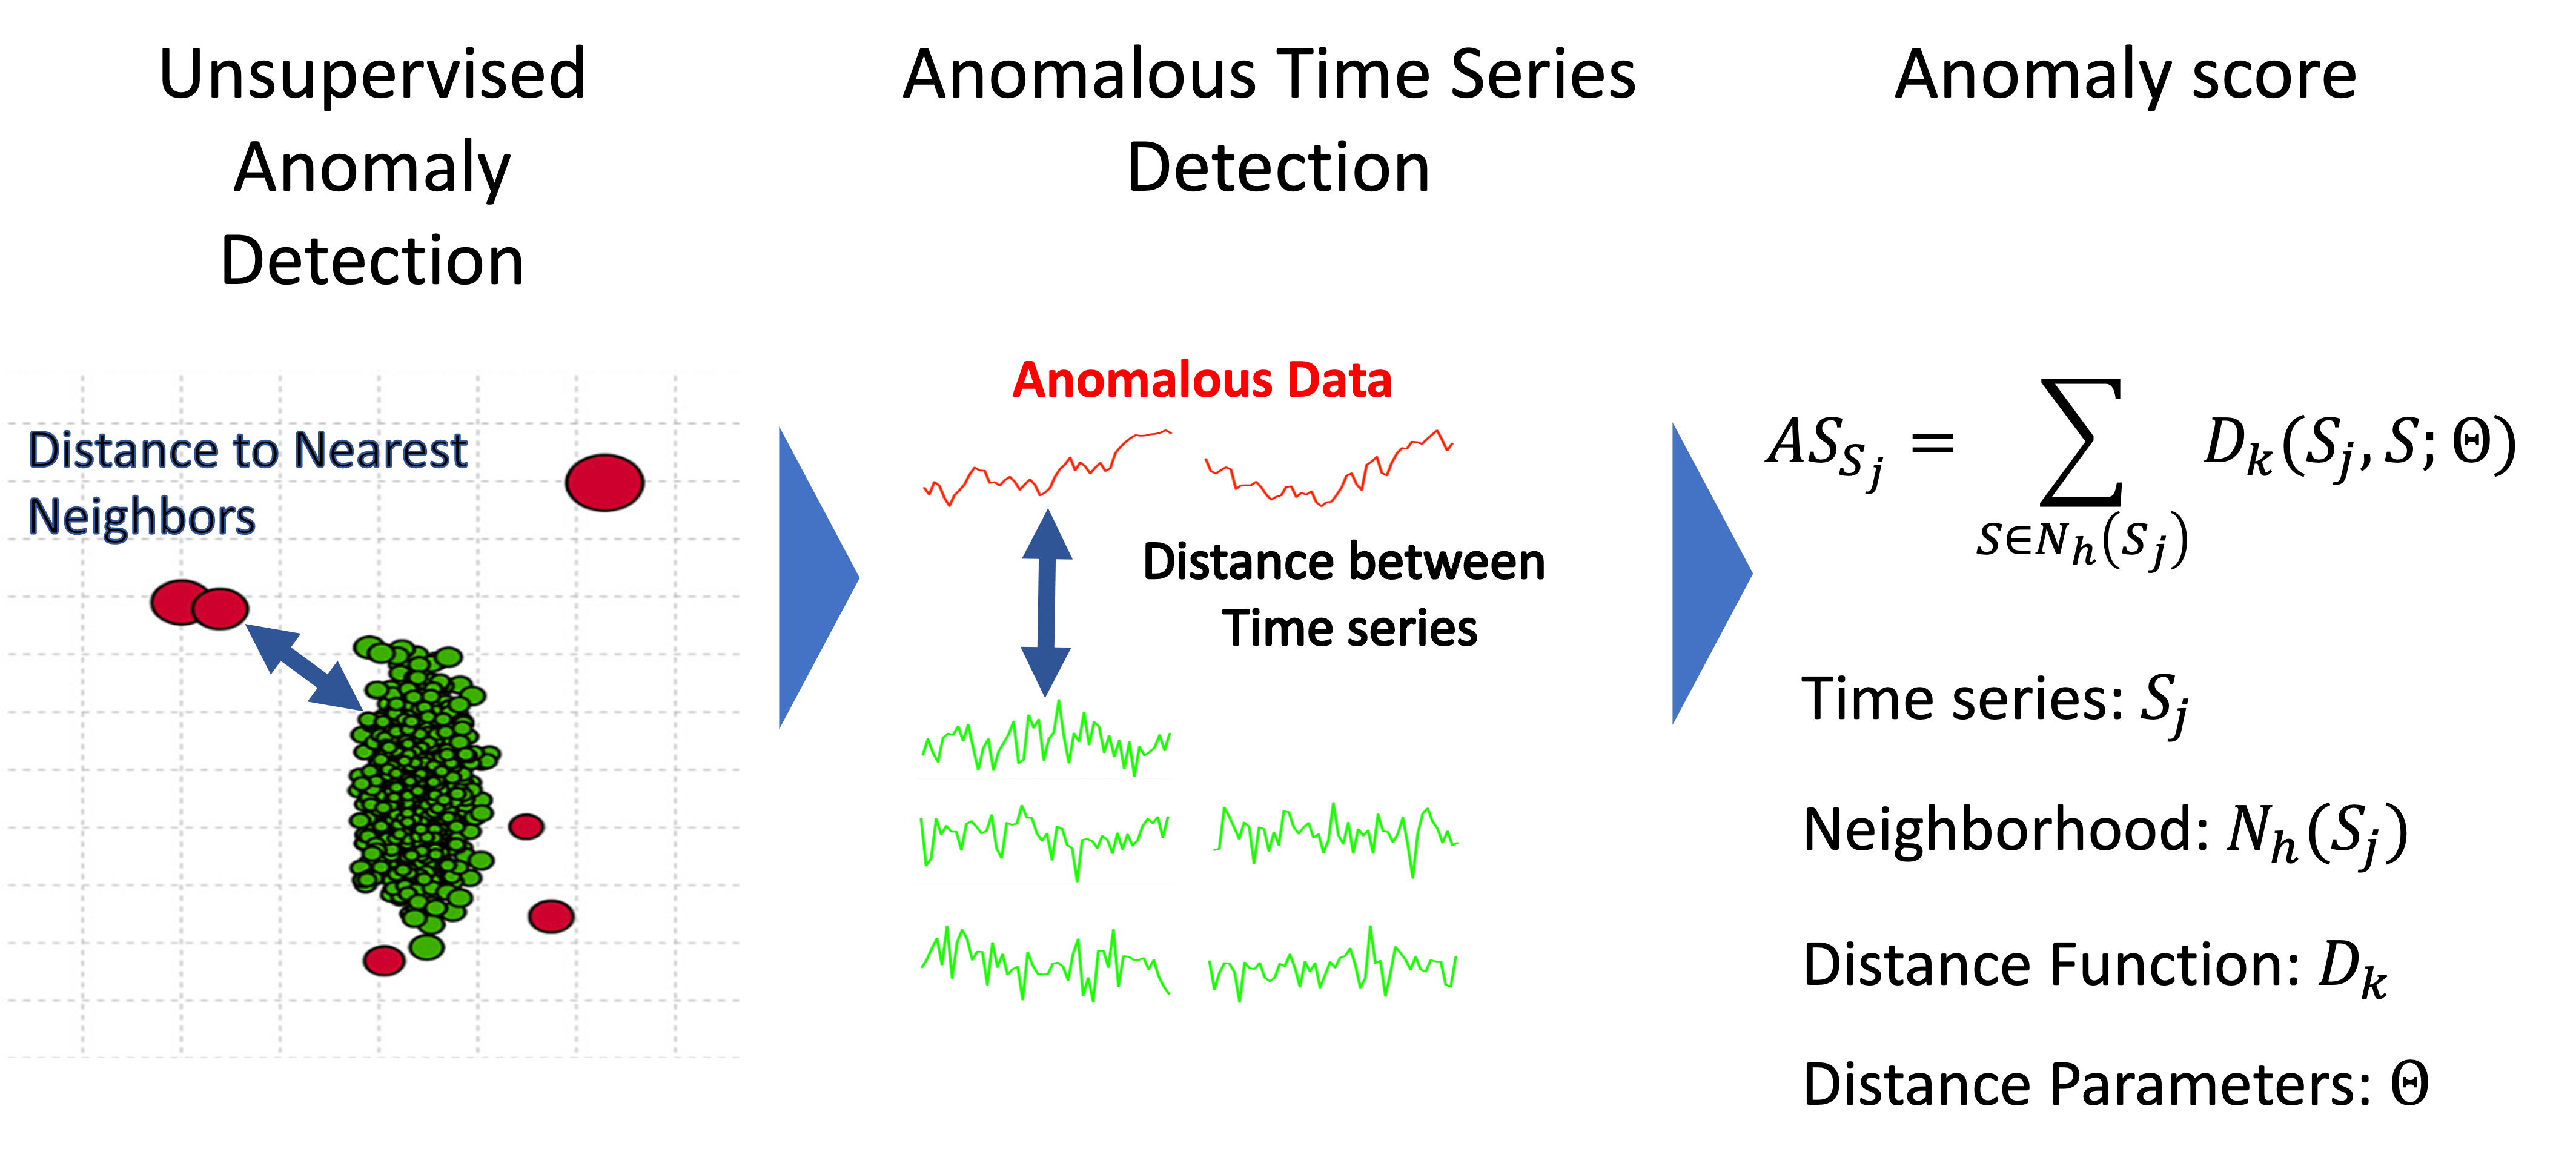
Anomalous data can be spotted for being far away from the rest of the observations. To identify these anomalies, we can calculate the distances for each observation to their nearest neighbours; then, for the anomalies, these distances will be considerable.
We can translate this general idea to multivariate time series by computing distances between time series and identifying the series that are distant with respect to the rest of the multivariate data.
Energy consumption patterns in complex building settings are represented by multivariate time series for sources such as electricity, gas, water, or external temporal information on temperature, pollution, etc. Then, with anomaly scores, we can identify deviant usage patterns in complex building settings.
The R Package AnomalyScore helps compute anomaly scores for multivariate time series, which are defined based on a KNN algorithm using different approaches to determine distances between time series. The selection of distances ranges from different statistical methodologies, which ensures that different data features are captured to achieve comprehensive analyses.
Visit this GitHub page to find the source code and the R CRAN page to access the package manual.
