Who are you?
I’m Emmie, an undergraduate English Language and Linguistics student at Lancaster University, and I have been working with the Questioning Vaccination Discourse (Quo VaDis) team through July and August as a SPRINT intern.
What is SPRINT?
SPRINT (Summer Project Research INTernship) is a four-week internship run by the Department of English Language and Linguistics, available to their second- and third-year students. This takes place in June, July or August, with the first few weeks focused on research, and ending with a presentation to the team of your findings. I applied as I was very interested to see what goes on in research projects, and also wanted to know more about vaccination discourse in general!
What have you been doing?
Throughout my time working on this project, I have learnt how to use Lancaster University’s own corpus linguistics software, #LancsBox, to search through thousands of tweets, published between 2020-2022, for hyperlinks related to MMR vaccinations , which were the focus of my investigation. Once I had extracted the hyperlinks, I created a series of spreadsheets (one for each half of the year) to put my links into in order to categorise them.
The categories I used were developed by another member of the team, William Dance. I found that the top categories that came up were UK Health (NHS websites, local GP twitter accounts), UK Government (government websites and twitter accounts), Social Media ( people expressing their opinions on the MMR vaccination) and UK News (news websites and twitter accounts).
I then used my spreadsheet to create graphs to show the distribution of the different categories over my focus time period, 2020 to 2022. These graphs mainly showed how many links were being shared in a certain time period, to get an idea of the topic and nature of discourse around MMR at the time.
What did the graphs tell you?
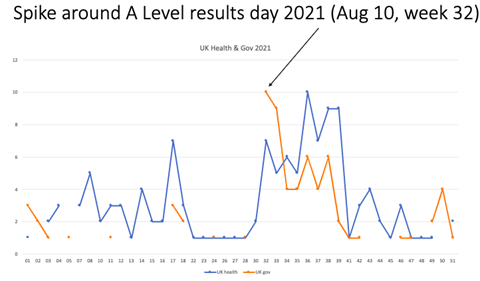
By creating graphs from my data set , I was able to see where there were certain spikes in the number of categories present each week. I could then look closer at that week, and see which events were going on which could have caused such a spike. For example, a spike in UK Health and UK Government tweets in Week 32 of 2021 correlated with A Level results day as you can see in the graph below; the tweets were urging students to get vaccinated before university.
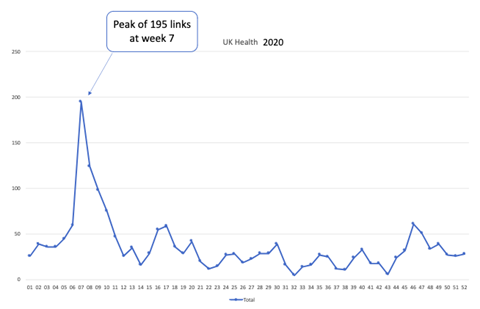
The graphs also correlated spikes in links being shared which were related to UK health, for example to mumps outbreaks in the UK such as this one in early 2020.
Overall, the graphs helped to show what direction the discourse around vaccination at different points in time was, by highlighting which categories were the most common in different weeks.
What was the most interesting thing about this project?
I found it very interesting to see that there was a potential knock-on effect from the Andrew Wakefield scandal in the late 90s, when he published a paper that falsely said the MMR vaccine caused autism. Twenty or so years on from this, in February 2020, there was a mumps outbreak in college and university aged students, who would have been of MMR vaccination age when the scandal broke.
This scandal was the main fuel for anti-vaxxers with the MMR jab, and even the Covid jab when that became available in late 2020, as the data set time period overlapped with the Covid pandemic.
What have you learnt from the internship?
I found working with the team extremely interesting, as not only do you get help and guidance from experts in the field, but you also gain insights into other research projects that have been carried out, such as the previous SPRINT intern Chris Sanderson’s research into anti-vaccination discourse through history.
This internship has taught me to think more analytically, and to connect pieces of data together – this allowed me to make the potential link between the Andrew Wakefield scandal, and the mumps outbreak 20 years later in 2020. This research project has really developed my spreadsheet skills, as having a thorough spreadsheet allowed me to easily analyse the data by creating relevant graphs. This will be useful in future employment as it can be applied to lots of situations. I really enjoyed developing my analysis and critical thinking skills, and seeing what working with a team on a research project is really like.