As a specialist in public transport network design and optimisation, I’m constantly observing how cities are evolving their mobility systems. The launch of Manchester’s Bee Network is one of the most ambitious projects in the UK, aiming for a truly integrated, London-style system.
A recently released set of data visualisations provides a fascinating snapshot of the network’s operational patterns. Looking beyond the numbers, these charts tell a story of a network with a strong foundation and clear opportunities for future optimisation.
|
|
 |
 |
 |
Key Finding 1: An All-Day Powerhouse with a Commuter Focus
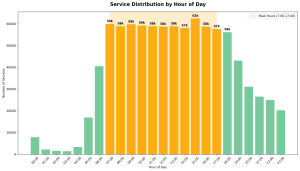
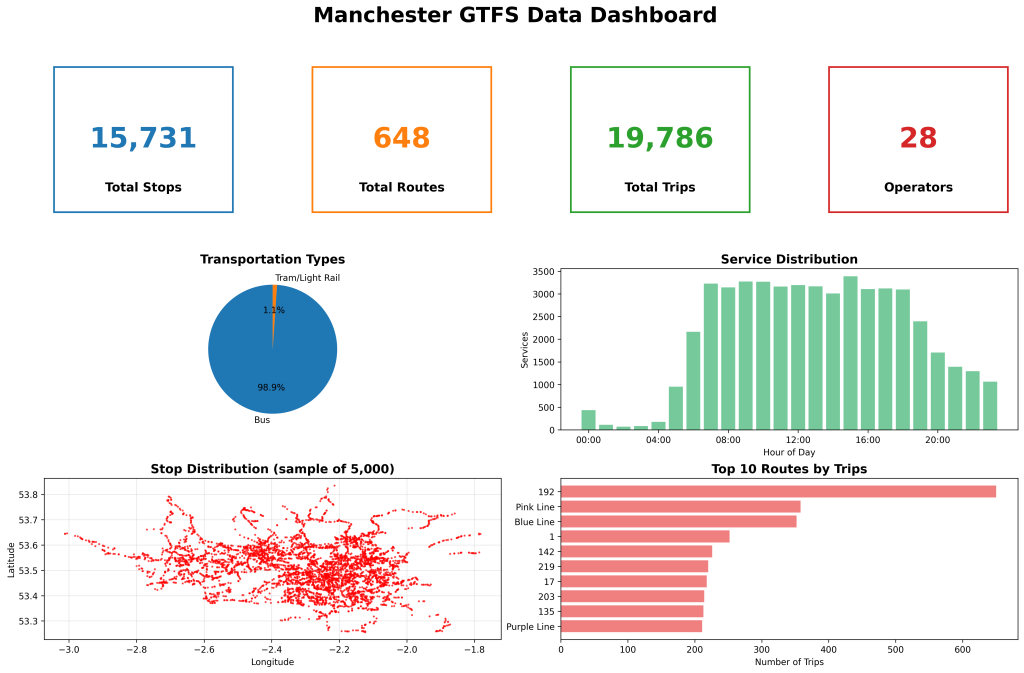
The “Service Distribution by Hour of Day” chart is particularly revealing. Unlike many cities that have sharp, distinct morning and evening peaks, Manchester’s network operates at a remarkably high and sustained level—between 57,000 and 62,000 services—from 7:00 through to 17:00.
Expert Take: This is excellent. A long, flat “peak” period promotes all-day public transport use, supporting not just traditional 9-to-5 commuters but also students, shoppers, and healthcare trips. It forms the backbone of a service that people can rely on throughout the day without consulting a timetable. The steep ramp-up from 05:00 shows the network is working hard to get the city moving early.
Key Finding 2: A Classic Radial Network with a Super-Spine
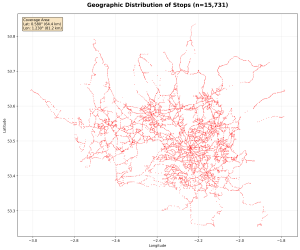
The geographic map of stops and the list of top routes confirm a classic “hub-and-spoke” network design. The 15,731 stops form clear corridors radiating from a dense city centre core.
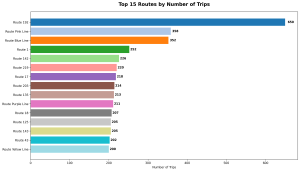
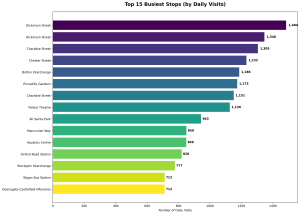
This is reinforced by the “Top 15 Routes” data. Route 192 is the undisputed spine of the entire system, with 650 daily trips—nearly double its closest peer. This is the kind of high-frequency, high-capacity corridor that makes a network legible and attractive. Similarly, the list of busiest stops—dominated by central locations like Dickinson Street, Piccadilly Gardens, and Charlotte Street—confirms that the city centre is the primary destination and transfer hub.
Opportunities for Future Optimisation
While the data shows a robust and well-used core system, a network planner always looks for what’s next. Based on these figures, here are three key areas for optimisation to elevate the Bee Network even further:
1. Bolstering the Evening and Night-Time Economy: The service levels drop sharply after 17:00. While a reduction is normal, the steepness of the decline may not fully support Manchester’s vibrant evening economy. To make public transport the default choice for evening leisure and hospitality workers, a key goal should be to extend the high-frequency “daytime” service pattern later into the evening, perhaps until 20:00 or 21:00, before tapering more gradually.
2. Strengthening Orbital Connections: The stop map clearly shows the network’s radial strength. The next frontier for optimisation is often in creating efficient orbital routes. These cross-suburban services allow passengers to travel between outer districts (e.g., from Rochdale to Bolton) without the need for a time-consuming trip into the city centre and back out. This is crucial for unlocking the network’s full potential and serving a wider variety of journey patterns.
3. Turning High Frequency into High Reliability: Route 192’s frequency is fantastic, but frequency alone doesn’t guarantee a quality service. For a corridor this critical, the next step is to invest in infrastructure that protects it from congestion. This means dedicated bus lanes, traffic signal priority, and upgraded stops that function like stations. The busiest stops like Piccadilly Gardens are assets, but also potential bottlenecks. Focusing on passenger flow, real-time information, and shelter at these key hubs is essential to manage the high demand effectively.
Conclusion
This data provides a compelling look “under the hood” of the Bee Network. It reveals a system built on a strong, high-frequency, city-centre-focused foundation. The challenge—and the opportunity—for the future will be to build upon this by enhancing evening services, developing orbital connections, and ensuring that the busiest routes are also the most reliable. This is how a good network evolves into a great one.
See my GitHub for more detailed plots.