AnomalyScore R Package, Granados-Garcia, G., 2024
This Package helps to compute anomaly scores for multivariate time series. The scores are defined based on a K nearest neighbor algorithm using different approaches to determine distances between time series.
github: https://github.com/Cuauhtemoctzin/AnomalyScore
CRAN: https://cran.r-project.org/web/packages/AnomalyScore/index.html
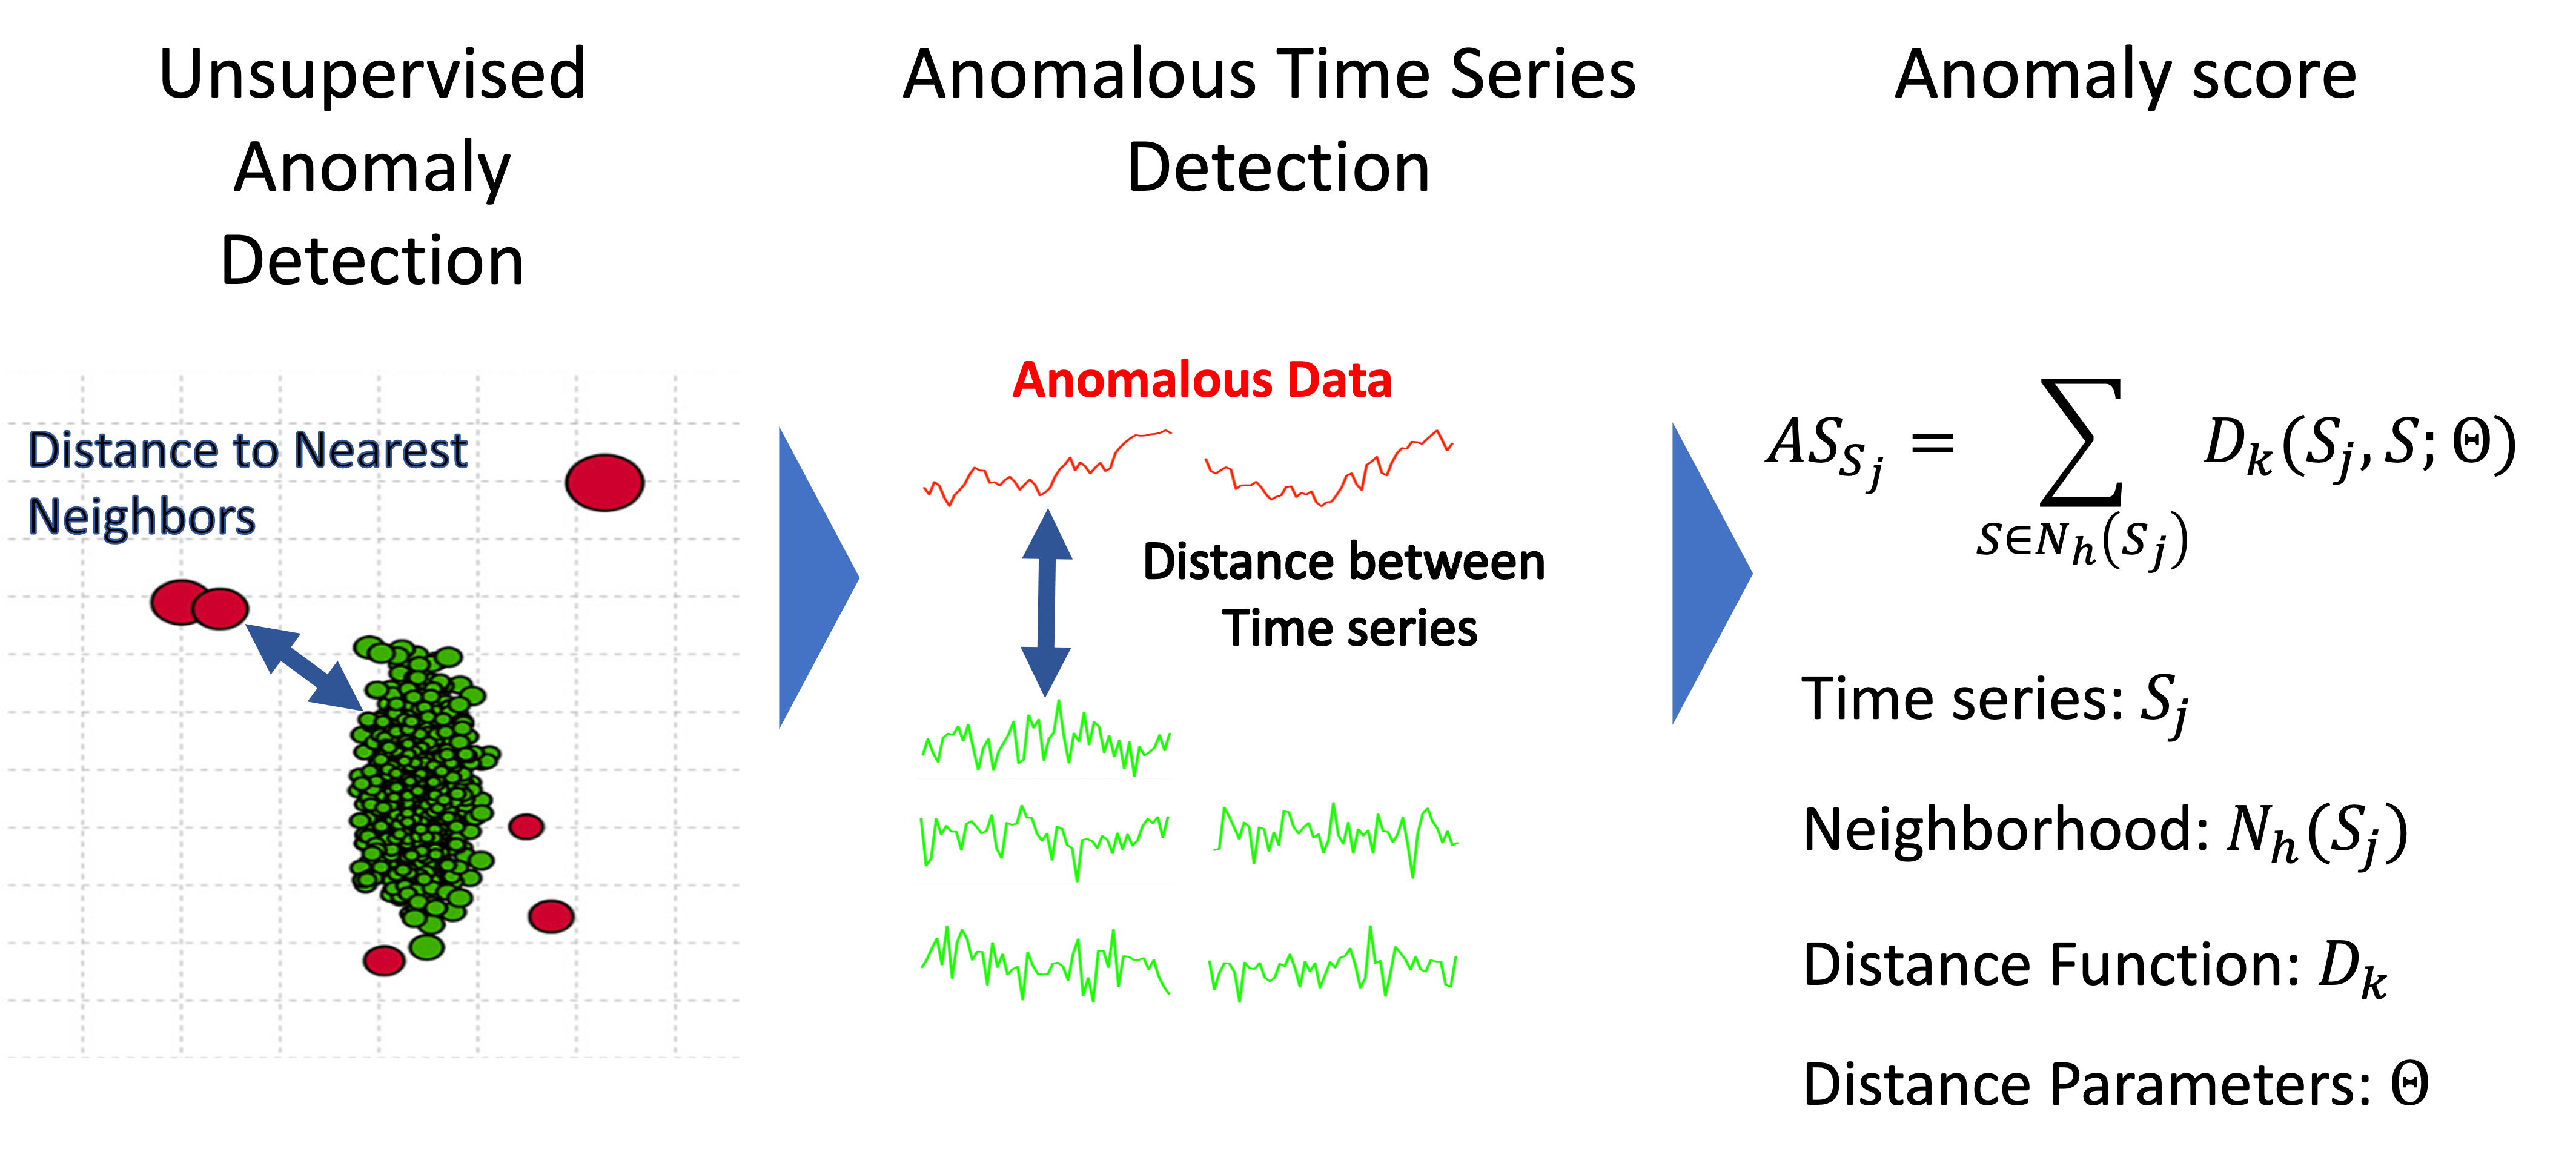
Anomalous data can be spotted for being far away from the rest of the observations. To identify these anomalies, we can calculate the distances for each observation to their nearest neighbours; then, for the anomalies, these distances will be considerable.
We can translate this general idea to multivariate time series by computing distances between time series and identifying the series that are distant with respect to the rest of the multivariate data.
Energy consumption patterns in complex building settings are represented by multivariate time series for sources such as electricity, gas, water, or external temporal information on temperature, pollution, etc. Then, with anomaly scores, we can identify deviant usage patterns in complex building settings.
The R Package AnomalyScore helps compute anomaly scores for multivariate time series, which are defined based on a KNN algorithm using different approaches to determine distances between time series. The selection of distances ranges from different statistical methodologies, which ensures that different data features are captured to achieve comprehensive analyses.
Visit this GitHub page to find the source code and the R CRAN page to access the package manual.
Tutorial
Interactive Energy Dashboard, Remy, C. 2024
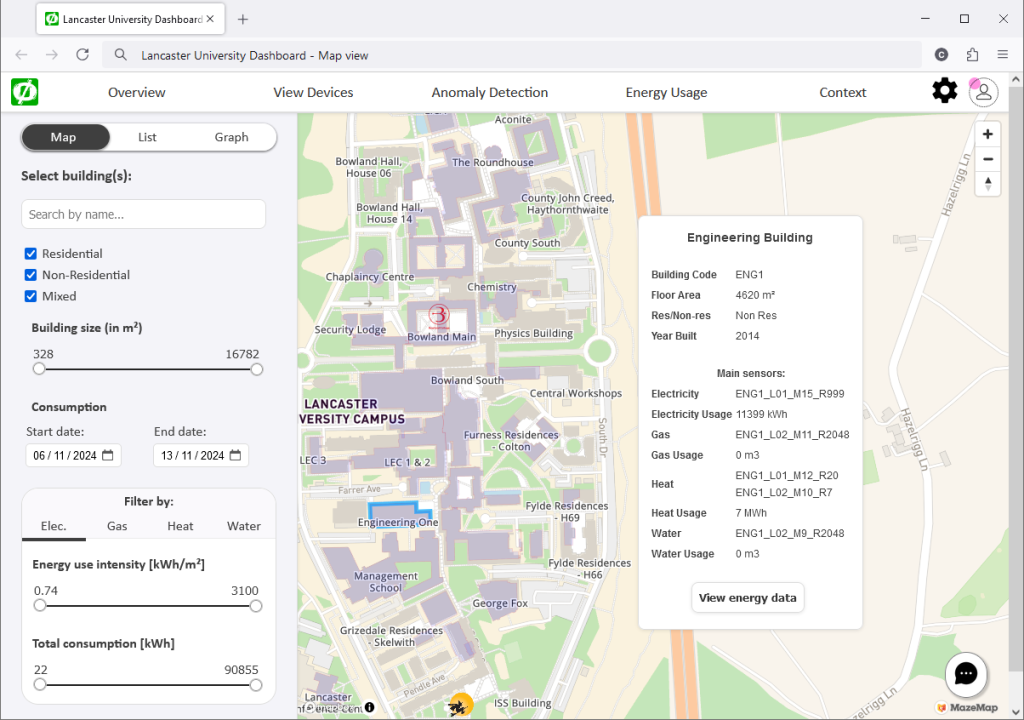
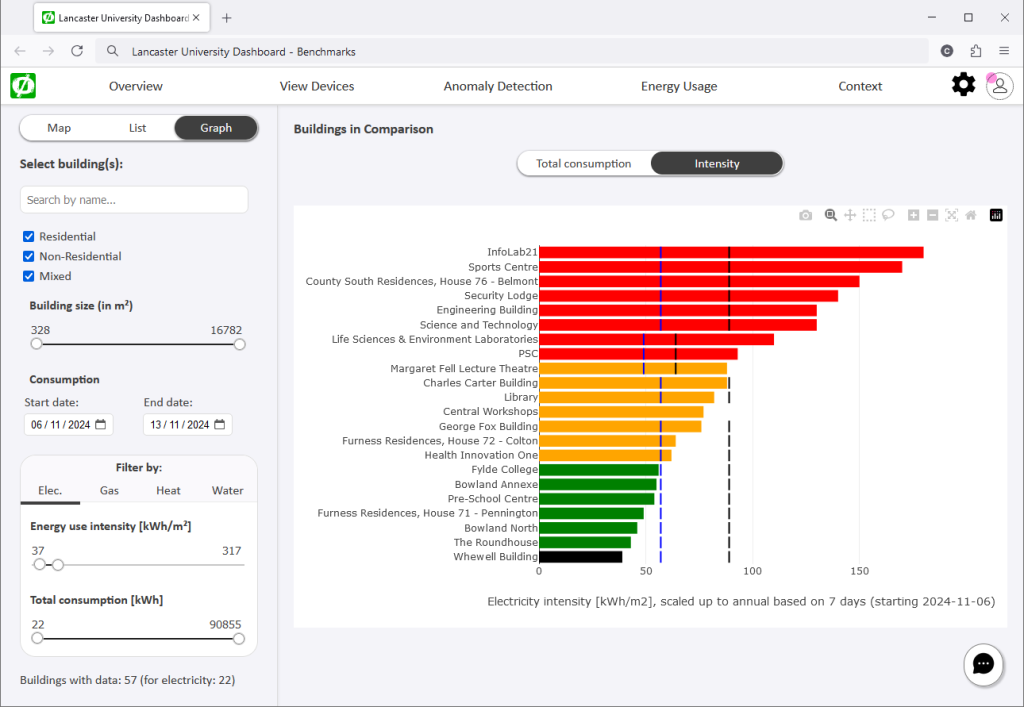
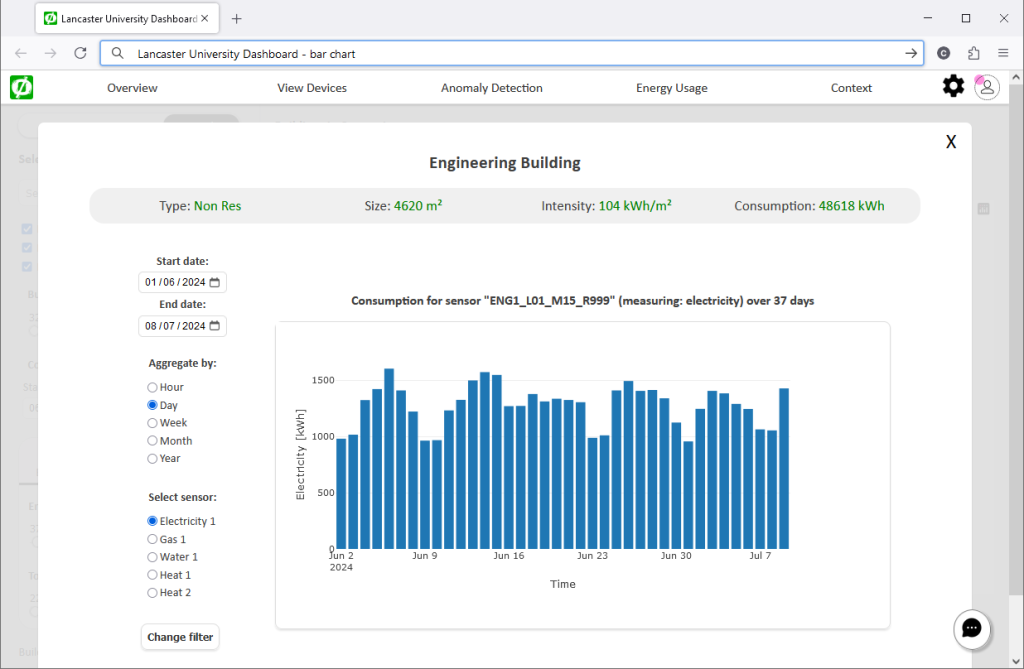
An interactive dashboard that takes historical energy data and displays it in different formats. Users can compare buildings with each other as well as to established industry benchmarks, search for information about specific buildings or sources of energy data readings, and see times of consumption considered not normal, i.e., particularly high, low, or simply not following expected patterns (so called “anomalies”).
demo: https://dashboard.christianremy.com/
github: https://github.com/ChristianAoC/energy-dashboard/

Energy management in corporate settings and public organisations is a complex subject that involves gathering, analysing, and interpreting vast amounts of energy data. Making such data accessible enables stakeholders to discuss potential savings, identify waste in consumption, and highlight opportunities for interventions.
As part of the Net0i Project, we developed an interactive dashboard that takes historical energy data and displays it in different formats. Users can compare buildings with each other as well as to established industry benchmarks, search for information about specific buildings or sources of energy data readings, and see times of consumption considered not normal, i.e., particularly high, low, or simply not following expected patterns (so called “anomalies”).
Another important functionality is the ability to add comments to a data series, to add what we call “context”. Context enables us to explain why and whenever values are raising eyebrows; for example, a unique event that resulted in higher-than-expected energy usage for a certain period in a specific building, or an intervention by the facility manager to save energy. Such context makes it easier for inhabitants of the space to understand the sea of data, while it allows for energy managers to annotate and communicate their findings.
Energy Usage Clustering Dashboard, Granados-Garcia, G., 2024
This dashboard benchmarks and clusters the different sources used in the Lancaster University buildings during 2023.
github: https://github.com/Cuauhtemoctzin/Energy_Usage_Clustering
Zenodo: https://doi.org/10.5281/zenodo.14396956
Understanding the usage patterns of buildings is key to developing energy management strategies. Complex building settings may display similar energy usage patterns for specific cycles, such as daily, weekly, monthly, and other periods like scholar terms. However, other building-specific factors might cause consumption patterns to differ according to internal activities such as research, teaching, catering, or administrative activities.
Other external or internal factors might cause energy usage to differ and be considered anomalous. When a building shows an abnormal pattern, other buildings might be affected in response to the anomaly. For instance, electric failure in a library might cause students to search for alternative venues to study. Therefore, identifying groups of buildings with strong usage associations can help develop contingency plans.
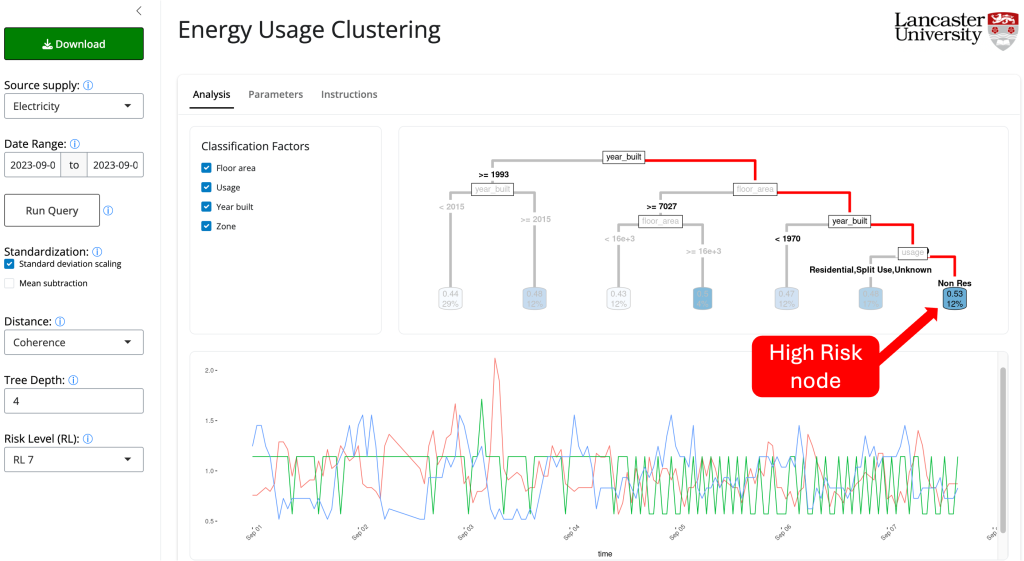
To understand the associations in usage patterns across buildings and support the development of energy management strategies. The Net0i team developed an Energy Clustering Dashboard to identify abnormal behaviours in energy usage by comparing the energy usage patterns across buildings. The dashboard assigns an anomaly score to each building, indicating the potential of the consumption pattern being anomalous. Then, to understand the factors driving the building consumption, a regression tree clusters the buildings based on the anomaly score and other known characteristics.
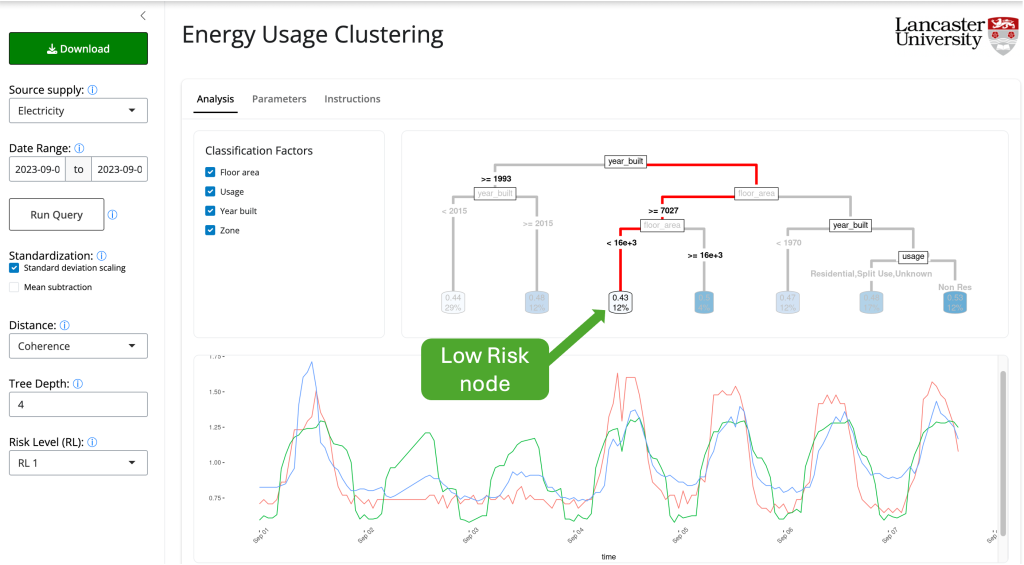
Buildings showing similar behaviour with a minimal risk of being anomalous will tend to be in nodes at the left of the tree with lighter shadowing. Meanwhile, anomalous buildings will tend to be assigned to nodes located to the right of the tree with a darker shadow. The dashboard allows highlighting specific nodes to show the buildings belonging to such nodes. Low-anomaly risk buildings share a regular and synchronized pattern. In contrast, high-risk buildings tend to be isolated from the rest or clustered with other buildings displaying similar anomalies.
Tutorial
Multivariate Time Series Anomaly Scoring Dashboard, Granados-Garcia, G., 2024
This dashboard allows public users to upload and explore anomalies in their data to benchmark multivariate time series via anomaly scores.
ShinyApps demo: https://cuauhtemoctzin.shinyapps.io/anomaly_tool/
github: https://github.com/Cuauhtemoctzin/anomaly_tool
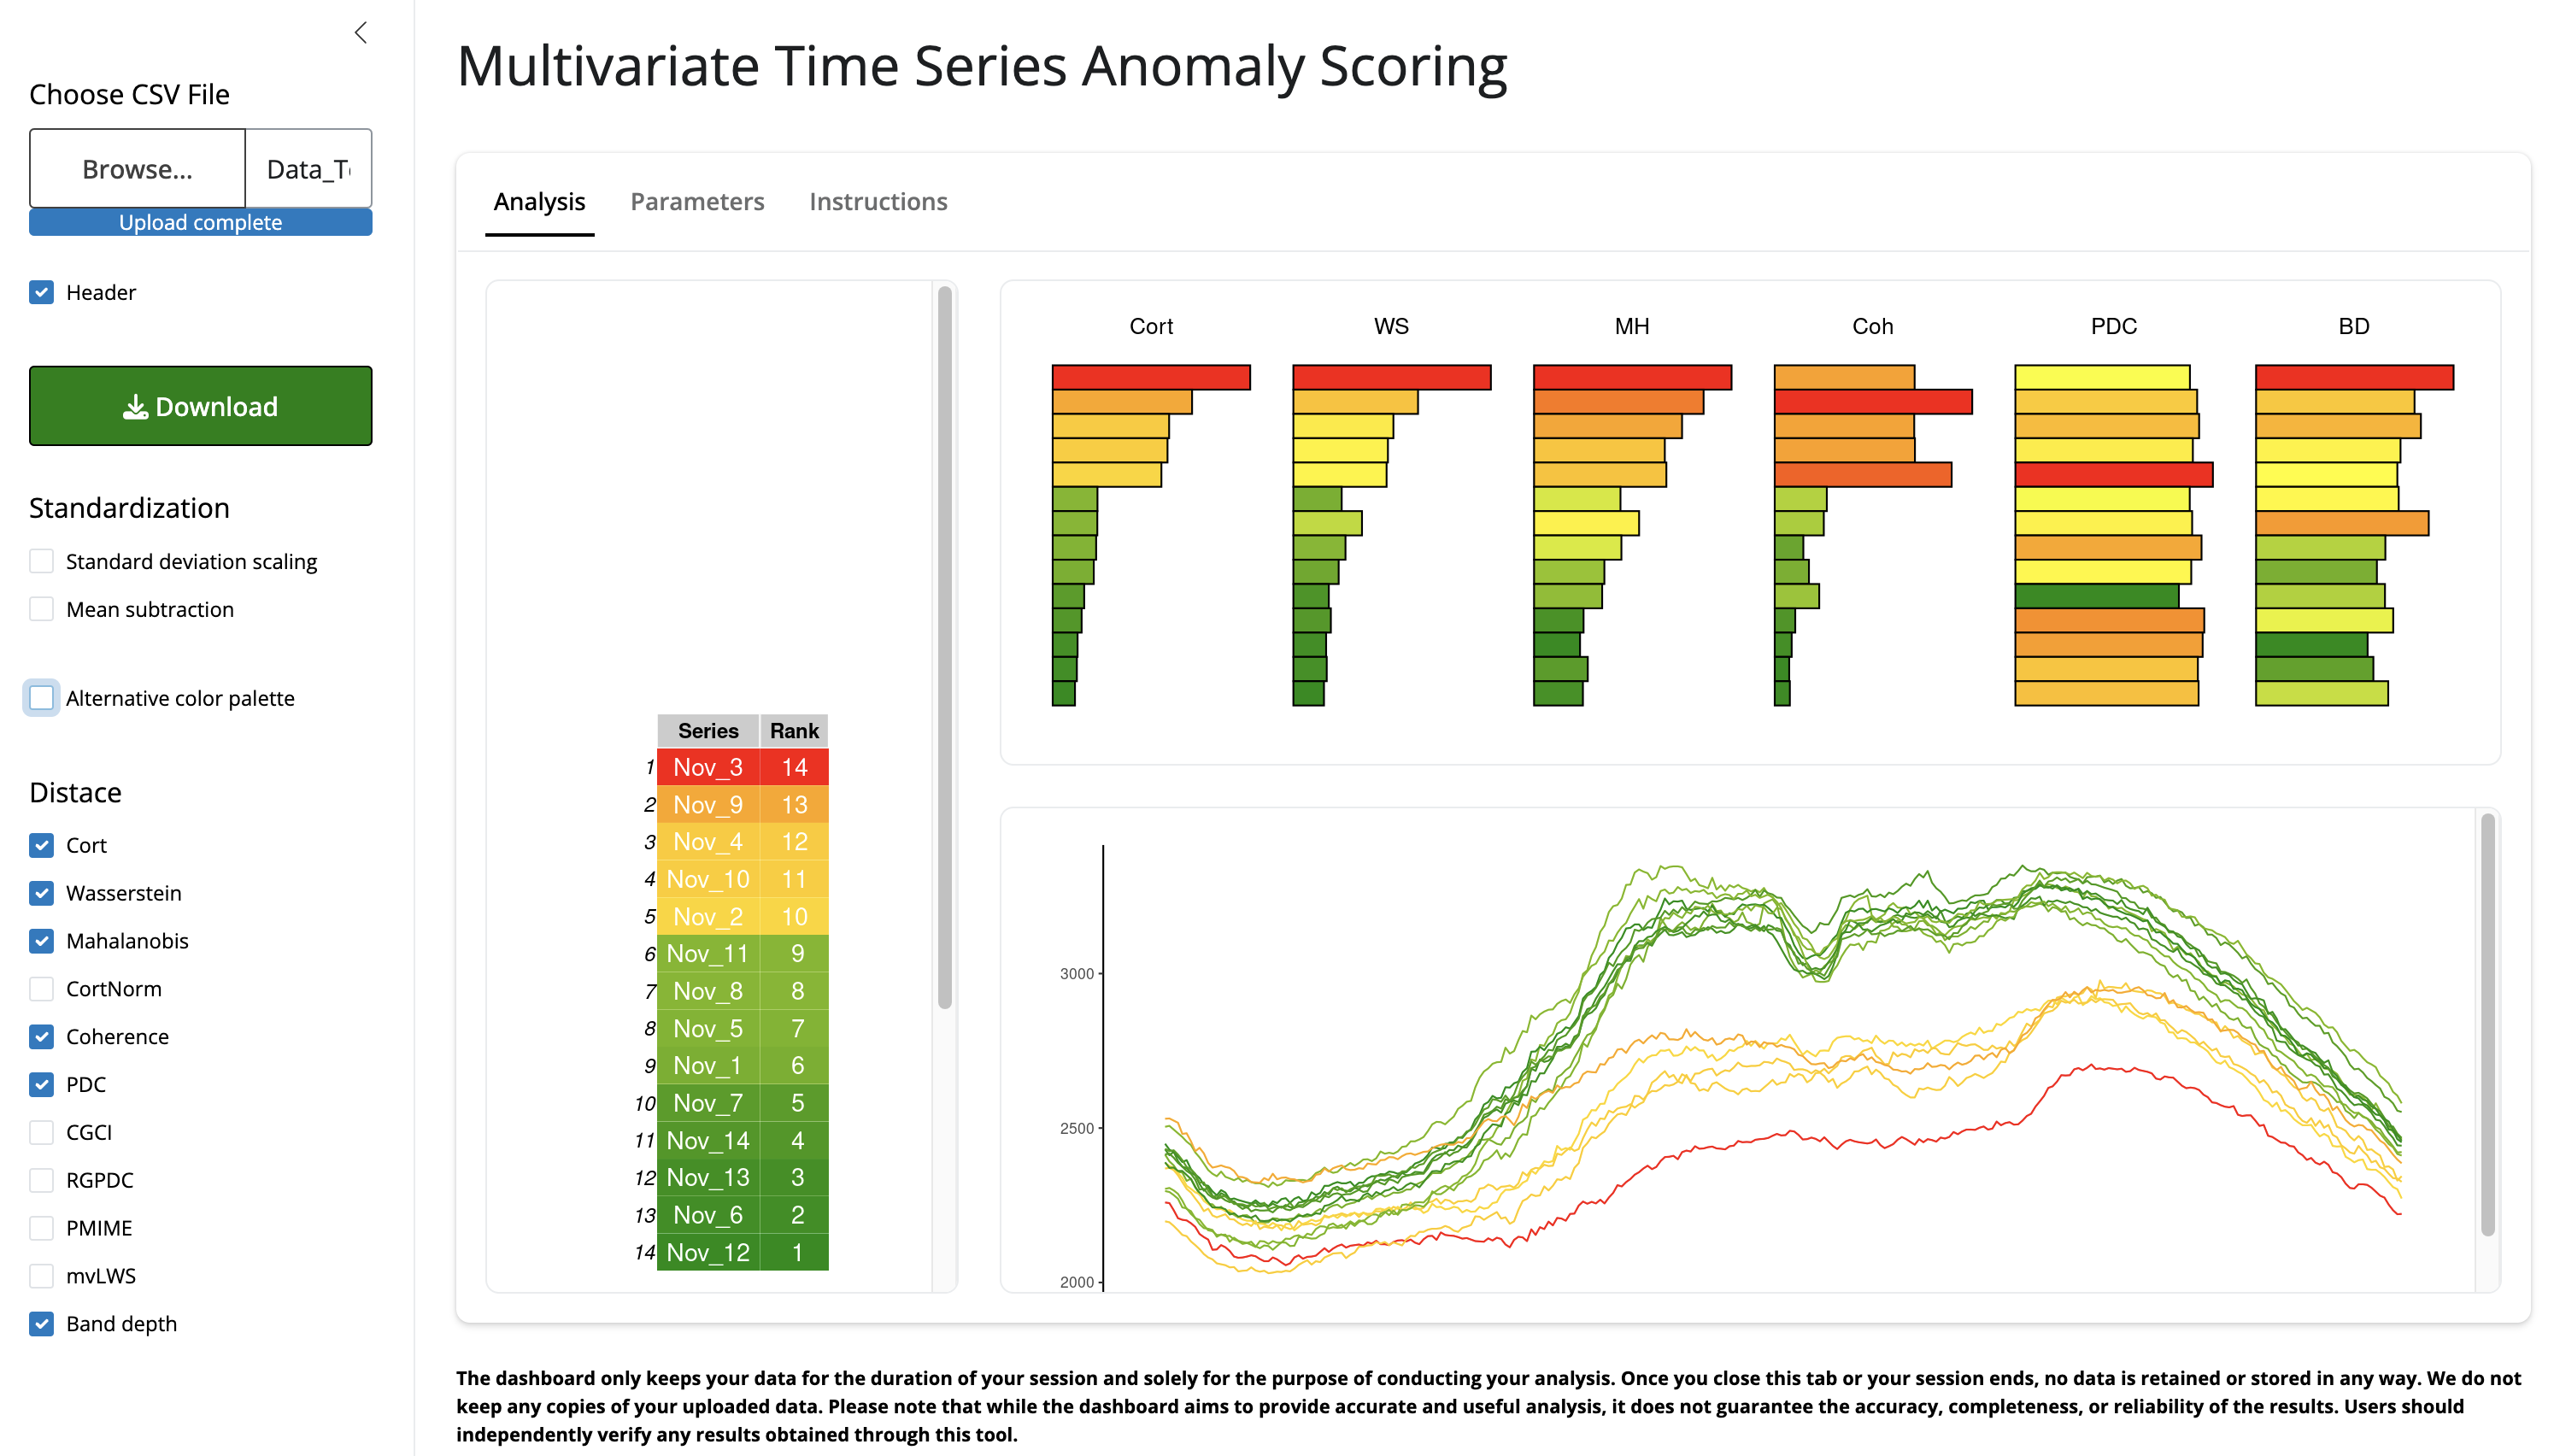
This dashboard allows users to upload, explore visually, and rank multivariate time series data by assigning anomaly scores using a nearest-neighbor approach. The anomaly scores are computed using the R package AnomalyScore . Different options to compute the scores are provided to ensure a comprehensive analysis of the data.
The dashboard only keeps your data for the duration of your session and solely for the purpose of conducting your analysis. Once you close this tab or your session ends, no data is retained or stored in any way. We do not keep any copies of your uploaded data.
Software and Data
anomalous, Smith, P., 2024, 10.5281/zenodo.14234769
https://waternumbers.github.io/anomalous/
an R package for detecting anomalies around profiles,
sparseDFM: Estimate Dynamic Factor Models with Sparse Loadings. Mosley, L., Chan, T.-S. and Gibberd, A., 2023, March. 10.32614/CRAN.package.sparseDFM
Implementation of various estimation methods for dynamic factor models (DFMs) including principal components analysis (PCA) Stock and Watson (2002) <doi:10.1198/016214502388618960>, 2Stage Giannone et al. (2008) <doi:10.1016/j.jmoneco.2008.05.010>, expectation-maximisation (EM) Banbura and Modugno (2014) <doi:10.1002/jae.2306>, and the novel EM-sparse approach for sparse DFMs Mosley et al. (2023) <doi:10.48550/arXiv.2303.11892>.
Lancaster University Energy Data (2023).
Dataset of energy data from 2023, in one hour aggregates, of several buildings and sub-meters (1153 data streams), in JSON format.